Help
- Model formulation document
- Scenario year
- Input data formats
- Emission tiers
- Modeling regions
- Reporting regions
- Output options
- Data retention policy
- Version updates
Model formulation document
For details on the NY-CHAPPA modeling framework, please see the NY-CHAPPA Model Formulation Document and Arunachalam et al. (2026).
Scenario year
When setting up a NY-CHAPPA v2.0 scenario, the Scenario Year setting determines which data to use for three calculations:
- The transported components, either from user-provided data or from base data, used for calculating total PM2.5
- The base concentrations, either from user-provided data or from base data, used for calculating changes in total PM2.5 (delta PM2.5)
- Built-in population and incidence data used for calculating health and economic impacts due to the changes in total PM2.5
If you provide your own transported components or base concentrations, make sure the Year column in the uploaded data files matches your selected Scenario Year.
Input data formats
All inputs are text-based CSV files.
Users who modify area emissions using Excel need to ensure that the values in the "geoid" column retain the exact census tract or block group IDs. Excel can often save the values in scientific notation, which truncates the geoid, and you may receive an error when uploading if the CSV saved the geoid values with scientific notation. To ensure that the file saves properly, you should highlight the geoid column, and then format the cells and choose Number with 0 decimal places.
Area emissions
For information about the tier1, tier2, and tier3 values supported by NY-CHAPPA v2.0, see Emission tiers.
| Name | Description | Units | Type | Example |
|---|---|---|---|---|
| geoid | 2020 census tract or block group ID | 11- or 12-digit string | 36001000100 | |
| tier1 | Tier 1 code | Integer | 2 | |
| tier2 | Tier 2 code | Integer | 1 | |
| tier3 | Tier 3 code | Integer | 99 | |
| nh3 | Annual NH3 emissions | tons/year | Numeric >= 0 | 0.00072700 |
| nox | Annual NOx emissions | tons/year | Numeric >= 0 | 0.24718159 |
| pm25 | Annual PM2.5 emissions | tons/year | Numeric >= 0 | 0.10810850 |
| so2 | Annual SO2 emissions | tons/year | Numeric >= 0 | 1.16766645 |
| voc | Annual VOC emissions | tons/year | Numeric >= 0 | 0.00363502 |
Emissions for census tracts larger than 20 square kilometers must be provided at the block group level. Emissions provided at the block group level but modeled at the tract level will be summed as needed.
Airport takeoff and landing emissions
Airport emissions can be modeled at three separate heights (0, 500, and 2000 feet). Use the tier codes to assign emissions for each height, as follows:
| Tier 1 | Tier 2 | Tier 3 | Modeling Height |
|---|---|---|---|
| 12 | 3 | 99 | 0 feet (0 meters) |
| 12 | 3 | 500 | 500 feet (150 meters) |
| 12 | 3 | 2000 | 2000 feet (600 meters) |
Note that tier codes 12_3_500 and 12_3_2000 can only be used with geoids identified as containing an airport. See the file CHAPPA_geoids_with_airports.csv for a list of these geoids in NY-CHAPPA v2.0.
For the large airports in New York City (JFK and LaGuardia), emissions at 2000 feet can be modeled using a special expanded shape. This shape is an 11-by-11 mile square centered at the location of the airport. To use the special shape, set the geoid to 36081971600 (JFK) or 36081933100 (LGA) along with the tier code 12_3_2000.
Road emissions
| Name | Description | Units | Type | Example |
|---|---|---|---|---|
| road_id | ID to match to system road network | Integer | 1 | |
| start_longitude | Road segment starting longitude | degrees | Numeric | -73.925486 |
| start_latitude | Road segment starting latitude | degrees | Numeric | 42.749585 |
| end_longitude | Road segment ending longitude | degrees | Numeric | -73.924415 |
| end_latitude | Road segment ending latitude | degrees | Numeric | 42.748948 |
| fips | FIPS code (used to assign segment to a modeling region) | 5-digit string | 36001 | |
| road_type | Road type (informational only) | Integer: 2 – 5 (see below for road types) | 4 | |
| nh3 | Annual NH3 emissions | tons/year | Numeric >= 0 | 0.02477286 |
| nox | Annual NOx emissions | tons/year | Numeric >= 0 | 0.11832313 |
| pm25 | Annual PM2.5 emissions | tons/year | Numeric >= 0 | 0.00407769 |
| so2 | Annual SO2 emissions | tons/year | Numeric >= 0 | 0.00574676 |
| voc_ld | Annual VOC emissions for light duty vehicles | tons/year | Numeric >= 0 | 0.00917919 |
| voc_hd | Annual VOC emissions for heavy duty vehicles | tons/year | Numeric >= 0 | 0.00337424 |
Road types
- 2: Rural Restricted Access
- 3: Rural Unrestricted Access
- 4: Urban Restricted Access
- 5: Urban Unrestricted Access
VOC emissions are split between light duty and heavy duty vehicles to allow for calculation of SOA emissions using scaling factors from COBRA.
Road segments must match the system road network, as verified by road_id and fips. Adding road segments is not supported in NY-CHAPPA v2.0.
Point emissions
| Name | Description | Units | Type | Example |
|---|---|---|---|---|
| longitude | Longitude | degrees | Numeric | -73.874283 |
| latitude | Latitude | degrees | Numeric | 42.583249 |
| fips | FIPS code (used to assign source to a modeling region) | 5-digit string | 36001 | |
| stkhgt | Stack height | feet | Numeric > 0 | 54.3684 |
| stkdiam | Stack diameter | feet | Numeric > 0 | 21.0714 |
| stktemp | Stack temperature | degrees Fahrenheit | Numeric > 0 | 186.3300 |
| stkflow | Stack flow (only used if stack velocity isn’t provided) | cubic feet/second | Numeric > 0, can be blank if stack velocity is provided | |
| stkvel | Stack velocity | feet/second | Numeric > 0, can be blank if stack flow is provided | 19.5200 |
| tier1 | Tier 1 code | Integer, must be either 1 or 2 | 2 | |
| tier2 | Tier 2 code | Integer, can be blank | ||
| tier3 | Tier 3 code | Integer, can be blank | ||
| nh3 | Annual NH3 emissions | tons/year | Numeric >= 0 | 0.00000000 |
| nox | Annual NOx emissions | tons/year | Numeric >= 0 | 0.39520161 |
| pm25 | Annual PM2.5 emissions | tons/year | Numeric >= 0 | 0.03436395 |
| so2 | Annual SO2 emissions | tons/year | Numeric >= 0 | 0.00236898 |
| voc | Annual VOC emissions | tons/year | Numeric >= 0 | 0.02173383 |
Point sources must match the master list of point sources modeled by NY-CHAPPA v2.0. This matching is done based on coordinates (longitude and latitude) and FIPS code. Adding point sources is not supported in NY-CHAPPA v2.0.
Transported components
Transported components represent the concentrations produced from emission sources outside the modeling region. These values are estimated using the COBRA model by zeroing out all emissions within the modeling region. See Modeling regions for the lists of counties within each modeling region.
| Name | Description | Units | Type | Example |
|---|---|---|---|---|
| fips | FIPS code | 5-digit string | 36001 | |
| year | Year: 2025, 2030, 2035, 2040, 2045, 2050 | Integer | 2025 | |
| pm25_transport | PM2.5 concentration | ug/m3 | Numeric | 1.61468 |
| soa_transport | SOA concentration | ug/m3 | Numeric | 1.16215 |
| so4_transport | SO4 concentration | ug/m3 | Numeric | 0.32561 |
| nh4_transport | NH4 concentration | ug/m3 | Numeric | 0.73899 |
| no3_transport | NO3 concentration | ug/m3 | Numeric | 0.99521 |
Base concentrations
A base concentrations file can be generated by running a NY-CHAPPA v2.0 scenario and setting the Base Concentrations option to "None; output concentrations only". This allows you to create your own custom baseline concentrations for calculating delta PM2.5 when modeling a scenario.
| Name | Description | Units | Type | Example |
|---|---|---|---|---|
| tract | 2020 census tract ID | 11-digit string | 36001000100 | |
| year | Year: 2025, 2030, 2035, 2040, 2045, 2050 | Integer | 2025 | |
| total_pm25 | Total PM2.5 concentration | ug/m3 | Numeric | 8.073350 |
Population
| Name | Description | Units | Type | Example |
|---|---|---|---|---|
| Year | Year: 2025, 2030, 2035, 2040, 2045, 2050 | Integer | 2025 | |
| census tract | 2020 census tract ID | 11-digit string | 36001000100 | |
| Age0 | Population age 0 | Numeric >= 0 | 25.5 | |
| Age1 | Population age 1 | Numeric >= 0 | 26.3 | |
| ... (Age2 through Age98) | ||||
| Age99 | Population age 99 | Numeric >= 0 | 1.2 | |
The population file must include data for all census tracts in New York State. The Year column must match the selected Scenario Year. Population values should be provided as decimal numbers.
Emission tiers
The 14 top level emission tiers (tier 1) are shown below. For a complete list of tiers 2 and 3 that NY-CHAPPA v2.0 supports, please see the spreadsheet CHAPPA_emission_tiers.csv
| Tier 1 Code | Tier 1 Description |
|---|---|
| 1 | Fuel Combustion: Electric Utility |
| 2 | Fuel Combustion: Industrial |
| 3 | Fuel Combustion: Other |
| 4 | Chemical & Allied Product Manufacturing |
| 5 | Metals Processing |
| 6 | Petroleum & Related Industries |
| 7 | Other Industrial Processes |
| 8 | Solvent Utilization |
| 9 | Storage & Transport |
| 10 | Waste Disposal & Recycling |
| 11 | Highway Vehicles |
| 12 | Off-Highway |
| 13 | Natural Resources |
| 14 | Miscellaneous |
Modeling regions
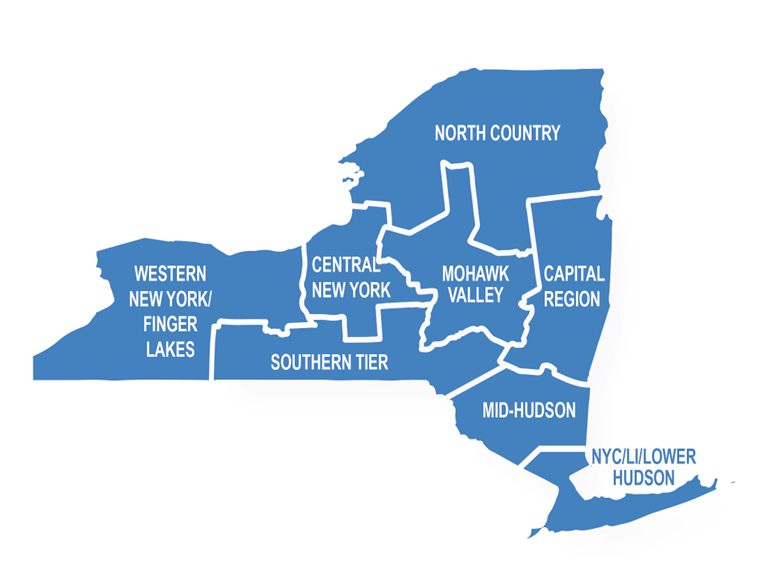
| Modeling Region | Counties |
|---|---|
| Capital Region | 36001, 36021, 36039, 36083, 36091, 36093, 36113, 36115 |
| Central New York | 36011, 36023, 36053, 36067, 36075 |
| Mid-Hudson | 36027, 36071, 36079, 36105, 36111 |
| Mohawk Valley | 36035, 36043, 36057, 36065, 36077, 36095 |
| North Country | 36019, 36031, 36033, 36041, 36045, 36049, 36089 |
| NYC / LI / Lower Hudson | 36005, 36047, 36059, 36061, 36081, 36085, 36087, 36103, 36119 |
| Southern Tier | 36007, 36015, 36017, 36025, 36097, 36101, 36107, 36109 |
| Western New York / Finger Lakes | 36003, 36009, 36013, 36029, 36037, 36051, 36055, 36063, 36069, 36073, 36099, 36117, 36121, 36123 |
Reporting regions
| Reporting Region | Counties |
|---|---|
| Capital Region | 36001, 36021, 36039, 36083, 36091, 36093, 36113, 36115 |
| Central New York | 36011, 36023, 36053, 36067, 36075 |
| Finger Lakes | 36037, 36051, 36055, 36069, 36073, 36099, 36117, 36121, 36123 |
| Hudson Valley | 36027, 36071, 36079, 36087, 36105, 36111, 36119 |
| Long Island | 36059, 36103 |
| Mohawk Valley | 36035, 36043, 36057, 36065, 36077, 36095 |
| New York City | 36005, 36047, 36061, 36081, 36085 |
| North Country | 36019, 36031, 36033, 36041, 36045, 36049, 36089 |
| Southern Tier | 36007, 36015, 36017, 36025, 36097, 36101, 36107, 36109 |
| Western New York | 36003, 36009, 36013, 36029, 36063 |
Output options
Tract-level results
Changes in tract-level concentrations and the associated health and economic impacts are output when you set the Base Concentrations option to either "Built-in baseline for scenario year" or "Custom; upload concentrations". If you select "None; output concentrations only", the output file will match the format described in Base concentrations.
Note that the Delta PM2.5 value is calculated as Total PM2.5 (PM2.5 calculated from the modeled scenario) - Base PM2.5. When health and economic impacts are calculated, the sign is flipped, so that the results represent incidences avoided and dollars saved. A scenario with lower concentrations than the base will produce negative delta PM2.5 values and positive impact values.
| Name | Description | Units | Type | Example |
|---|---|---|---|---|
| Tract | 2020 census tract ID | 11-digit string | 36001000100 | |
| Region | Reporting region name | String | Capital Region | |
| 2025 Population | Total population in census tract for 2025 | Numeric | 2234.030259 | |
| Year | Year: 2025, 2030, 2035, 2040, 2045, 2050 | Integer | 2025 | |
| Delta PM2.5 (ug/m^3) | Change in total PM2.5 concentration (Total - Base) | ug/m3 | Numeric | |
| Total PM2.5 (ug/m^3) | Total PM2.5 concentration | ug/m3 | Numeric | |
| Base PM2.5 (ug/m^3) | Base total PM2.5 concentration | ug/m3 | Numeric | |
| Mortality (low estimate) | Numeric | |||
| Mortality (high estimate) | Numeric | |||
| Infant Mortality | Numeric | |||
| Nonfatal Heart Attacks (low estimate) | Numeric | |||
| Nonfatal Heart Attacks (high estimate) | Numeric | |||
| Hospital Admits, All Respiratory | Numeric | |||
| Hospital Admits, All Respiratory Direct | Numeric | |||
| Hospital Admits, Asthma | Numeric | |||
| Hospital Admits, Chronic Lung Disease | Numeric | |||
| Hospital Admits, Cardio (except heart attacks) | Numeric | |||
| Acute Bronchitis | Numeric | |||
| Upper Respiratory Symptoms | Numeric | |||
| Lower Respiratory Symptoms | Numeric | |||
| Emergency Room Visits, Asthma | Numeric | |||
| Minor Restricted Activity Days | Numeric | |||
| Work Loss Days | Numeric | |||
| Asthma Exacerbation | Numeric | |||
| Asthma Exacerbation, Cough | Numeric | |||
| Asthma Exacerbation, Shortness of Breath | Numeric | |||
| Asthma Exacerbation, Wheeze | Numeric | |||
| Total Health Benefits (low estimate) ($) | $ | Numeric | ||
| Total Health Benefits (high estimate) ($) | $ | Numeric | ||
| Mortality (low estimate) ($) | $ | Numeric | ||
| Mortality (high estimate) ($) | $ | Numeric | ||
| Infant Mortality ($) | $ | Numeric | ||
| Nonfatal Heart Attacks (low estimate) ($) | $ | Numeric | ||
| Nonfatal Heart Attacks (high estimate) ($) | $ | Numeric | ||
| Hospital Admits, All Respiratory ($) | $ | Numeric | ||
| Hospital Admits, Cardiovascular ($) | $ | Numeric | ||
| Acute Bronchitis ($) | $ | Numeric | ||
| Upper Respiratory Symptoms ($) | $ | Numeric | ||
| Lower Respiratory Symptoms ($) | $ | Numeric | ||
| Emergency Room Visits, Asthma ($) | $ | Numeric | ||
| Minor Restricted Activity Days ($) | $ | Numeric | ||
| Work Loss Days ($) | $ | Numeric | ||
| Asthma Exacerbation ($) | $ | Numeric |
By-tier results
| Name | Description | Units | Type | Example |
|---|---|---|---|---|
| Tract | 2020 census tract ID | 11-digit string | 36001000100 | |
| Tier 1 | Tier 1 emission code and source type | String | 2 area | |
| Tier 2 | Tier 2 emission code | Integer | 1 | |
| Tier 3 | Tier 3 emission code | Integer | 0 | |
| Total PM2.5 (ug/m^3) | Estimate of total PM2.5 concentration contributed by this tier | ug/m3 | Numeric | 0.210132 |
Regional aggregation report
In addition to tract-level results, scenario results are available aggregated by reporting region. See Reporting regions for the lists of counties within each reporting region.
| Name | Description | Units | Type | Example |
|---|---|---|---|---|
| Region | Name of the reporting region | String | New York City | |
| Total Health Benefits, High, DAC ($) | Total health benefits (high estimate) for tracts designated as DAC | $ | Integer | 207,200 |
| Total Health Benefits, High, Non-DAC ($) | Total health benefits (high estimate) for tracts designated as Non-DAC | $ | Integer | 117,674 |
| Total Region Health Benefits, High ($) | Total health benefits (high estimate) for all tracts | $ | Integer | 324,874 |
| Fraction of Total Health Benefits, High, DAC | Fraction of total health benefits (high estimate) for tracts designated as DAC | % | Integer | 64 |
| Fraction of Total Health Benefits, High, Non-DAC | Fraction of total health benefits (high estimate) for tracts designated as Non-DAC | % | Integer | 36 |
| Total Health Benefits, Low, DAC ($) | Total health benefits (low estimate) for tracts designated as DAC | $ | Integer | 93,382 |
| Total Health Benefits, Low, Non-DAC ($) | Total health benefits (low estimate) for tracts designated as Non-DAC | $ | Integer | 52,375 |
| Total Region Health Benefits, Low ($) | Total health benefits (low estimate) for all tracts | $ | Integer | 145,757 |
| Fraction of Total Health Benefits, Low, DAC | Fraction of total health benefits (low estimate) for tracts designated as DAC | % | Integer | 64 |
| Fraction of Total Health Benefits, Low, Non-DAC | Fraction of total health benefits (low estimate) for tracts designated as Non-DAC | % | Integer | 36 |
| Fraction of 2025 Population, DAC | Percentage of population in DAC tracts | % | Integer | 49 |
| Fraction of 2025 Population, Non-DAC | Percentage of population in Non-DAC tracts | % | Integer | 51 |
Data retention policy
As part of our data management and clean-up policy, all results generated from your NY-CHAPPA v2.0 scenario will be kept for 7 days. After this period, the results will be removed. We encourage you to download your results while they are available.
Version updates
NY-CHAPPA v2.0 (20260130)
- Added option to use custom population data for calculating health and economic impacts
- Added option to use a custom discount rate for mortality
- Added ability to download reference and scenario emissions
- Updated base transported components to use COBRA5-based values
NY-CHAPPA v2.0 (20251202)
- Generated the regional aggregation report in the results.
- Included the regional aggregation report in the results ZIP archive.
- Updated the Help page with a description of the regional aggregation report.
NY-CHAPPA v2.0 (20251109)
- Renamed to NY-CHAPPA v2.0
CHAPPA-Op version 20251028
- Removed old economic impact adjustment now that valuation numbers are in 2024 dollars
CHAPPA-Op version 20251026
- Updated economic impacts to be reported in 2024 dollars
CHAPPA-Op version 20251020
- Updated "Emergency Room Visits, Asthma" incidence data to adjust by a factor of 100
- Revised population data
CHAPPA-Op version 20251014
- Updated incidence data based on 2020 tracts to use additional decimal places for mortality
- Fixed issue with new incidence data causing "Emergency Room Visits, Asthma" to be zero
- Revised population estimates for all years
CHAPPA-Op version 20251006
- Updated to use census 2020 tract definitions
- Revised VSL based on a 5.03% discount rate
CHAPPA-Op version 20250626
- Fix calculation of tract-level results so that health and economic impacts are zero when delta PM2.5 is smaller than precision limit
- Add information about the Scenario Year setting and tract-level results sign conventions to the Help page
CHAPPA-Op version 20250612
- Add by-tier results
CHAPPA-Op version 20250606
- Updated tract-level population data
- Use custom CR functions for "Emergency Room Visits, Asthma" and "Hospital Admits, Cardio (except heart attacks)" for tracts in New York City
- Enable option to automatically calculate transported components
CHAPPA-Op version 20250522
- Implemented one week data retention policy
- Expanded treatment of aircraft sources to include modeling heights
- Added additional point locations to master list
CHAPPA-Op version 20250424
- Initial version of CHAPPA-Op separate from public CHAPPA
- Updated receptors to avoid having them be too close to roads
CHAPPA version 20250319
- Fix a bug that caused scenarios that use the "output concentrations only" option to fail incorrectly
- Add new "Emission tiers" section to the Help page with a spreadsheet listing all tier1, tier2, and tier3 codes supported by CHAPPA
CHAPPA version 20250313
- Fix a bug where point sources may not use the intended met station
- Update built-in baseline concentrations using corrected point source modeling
CHAPPA version 20250218
- Initial demo version